
Traders can leverage small mispricings in the forex market using a statistical arbitrage strategy. This strategy allows traders to capitalize on short-term market anomalies in highly liquid markets.
This article will discuss how to use the statistical arbitrage strategy.
*This is an example only to enhance a consumer's understanding of the strategy being described above and is not to be taken as Blueberry Markets providing personal advice.
What is the statistical arbitrage strategy?
The statistical arbitrage strategy is a quantitative trading approach that exploits market inefficiencies using statistical models and historical market data. It is based on identifying and capitalizing on temporary deviations from expected prices. The fundamentals of the statistical arbitrage trading strategy are –
-
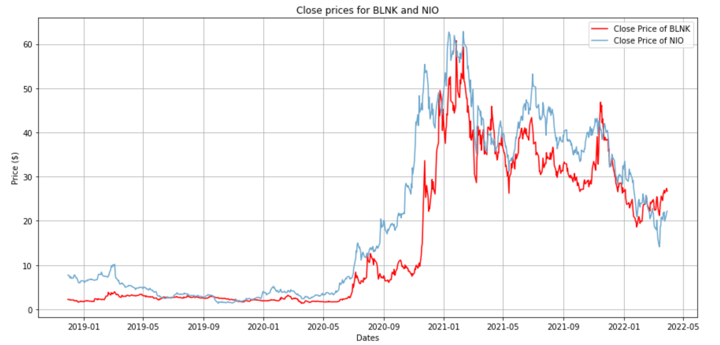
Pairs trading: Traders trade two pairs that are historically correlated by taking opposite positions in both of them when the prices diverge from the usual
-
Mean reversion: Prices are expected to revert to their historical average under this strategy, so traders can trade as soon as there is a temporary deviation
-
Market neutrality: The strategy eliminates exposure to market-wide movements and balances long and short positions to capture gains in both falling and rising markets
-
High frequency: Traders can execute a high volume of trades in only a little time to exploit tiny price inefficiencies in the market quickly
-
Quantitative models: This strategy primarily relies on mathematical and statistical models to analyze historical data
Top indicators to use with the statistical arbitrage strategy
Mean reversion indicators
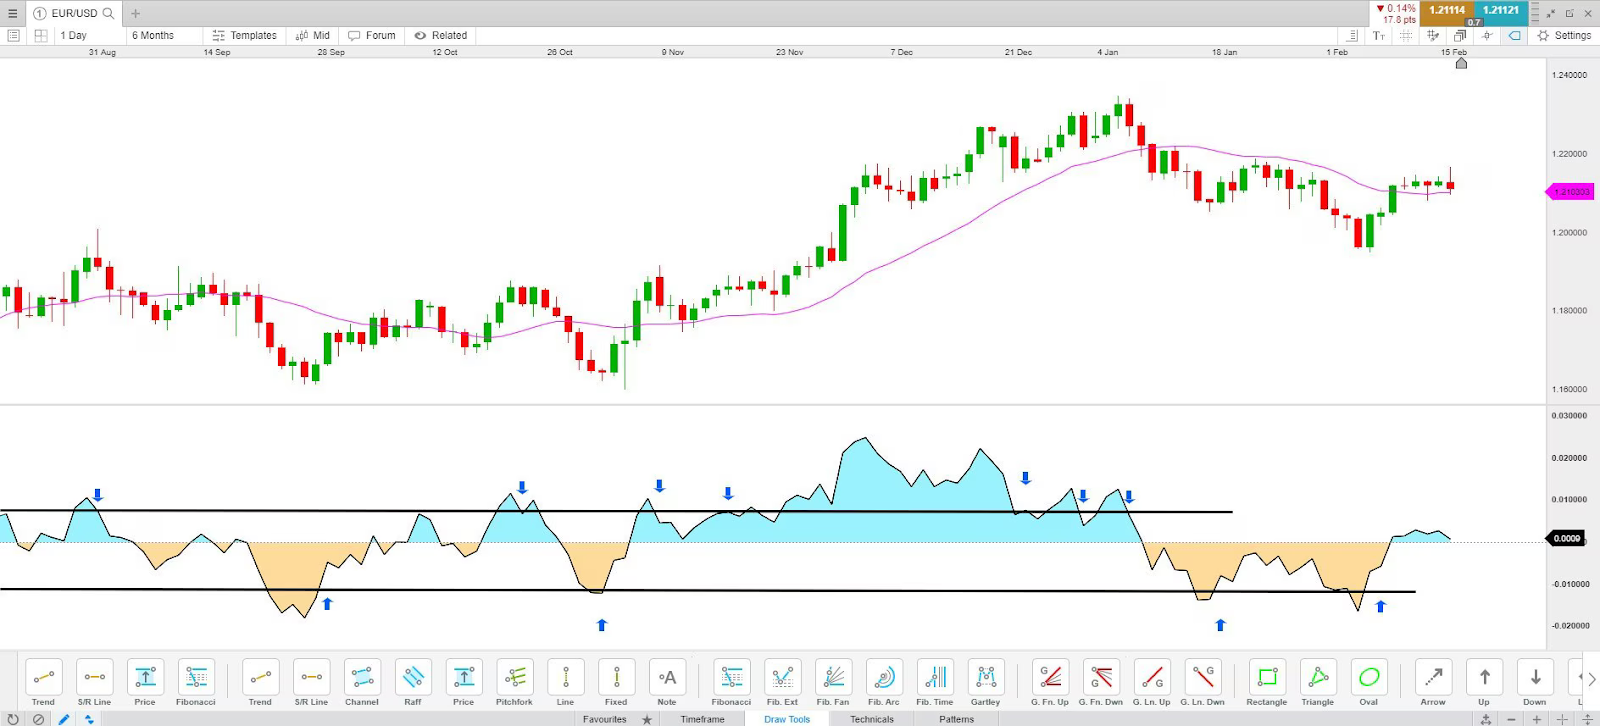
Mean reversion indicators include technical indicators like Bollinger bands and a relative strength index to identify oversold/overbought market conditions. They suggest that prices can revert to their historical averages any time. Traders can easily spot deviations from the mean and gain from price inefficiency.
Cointegration indicators
Cointegration indicators measure the long-term relationship between two or more time periods of the same currency pair. This allows traders to enter trading opportunities when a price deviation occurs in the current trend’s opposite direction, expecting the prices to retrace. Indicators like the Engle-Granger test help identify such mean-reverting relationships.
Volatility indicators
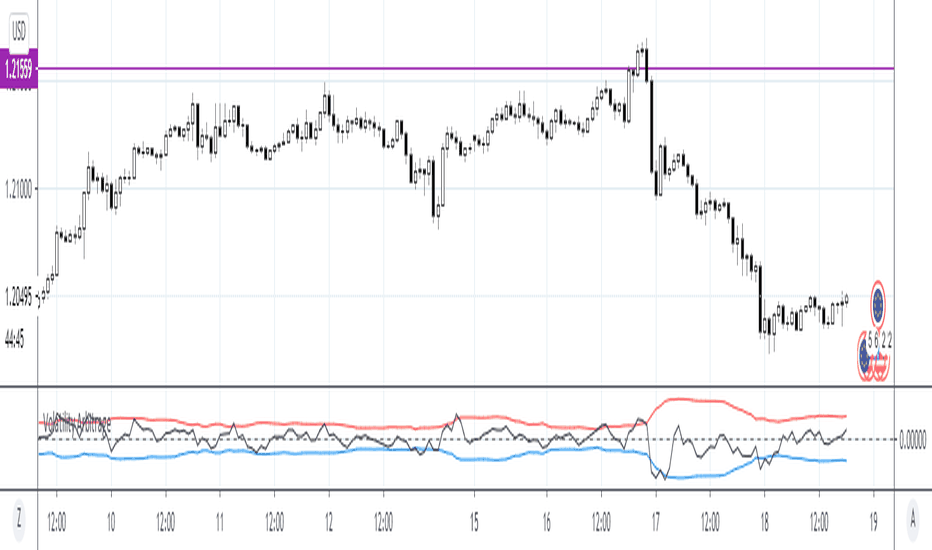
Volatility indicators like the average true range measure price fluctuations based on historical prices. High volatility signals potential mean-reversion opportunities, allowing traders to enter trades in the opposite direction of the current trend. Low volatility, on the other hand, suggests that the markets are stable, letting traders adjust their strategies accordingly.
Statistical indicators
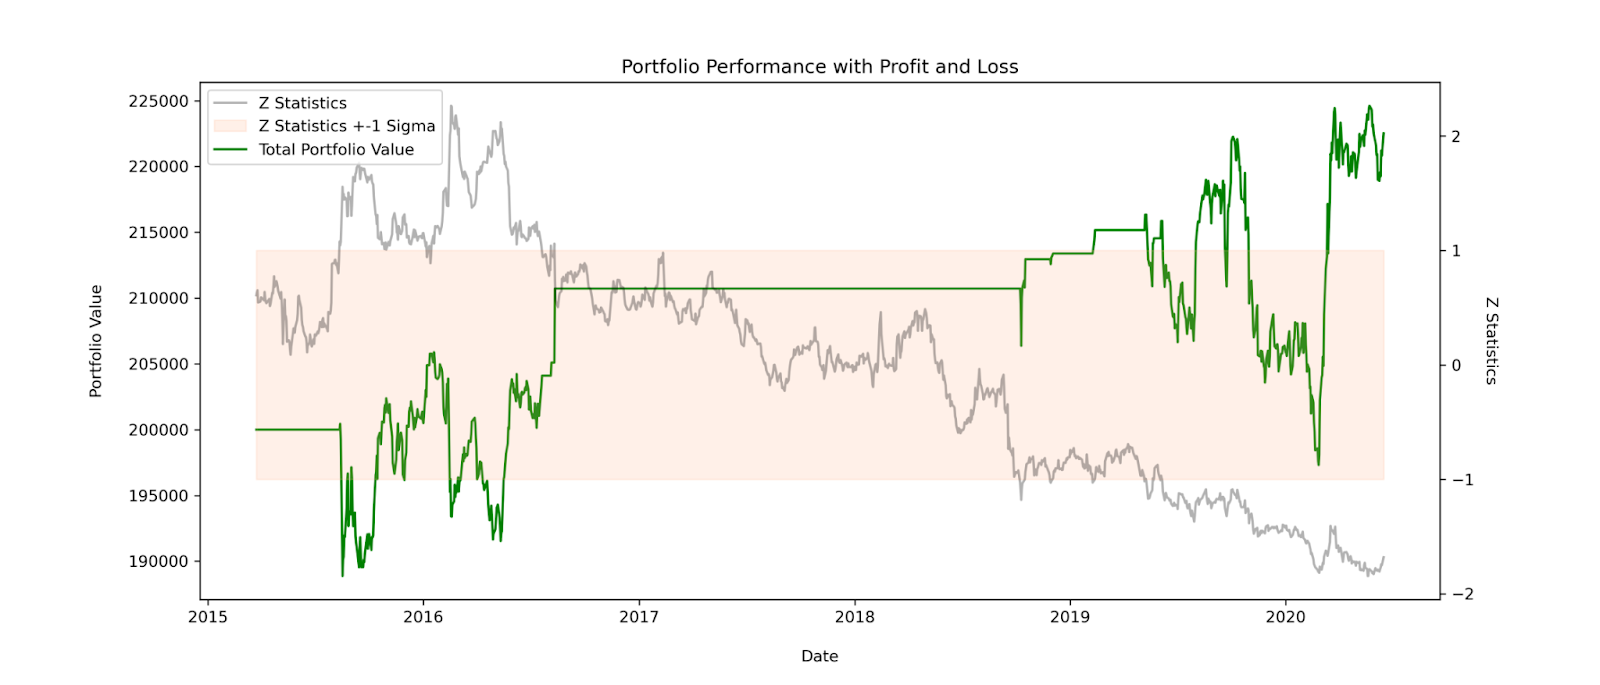
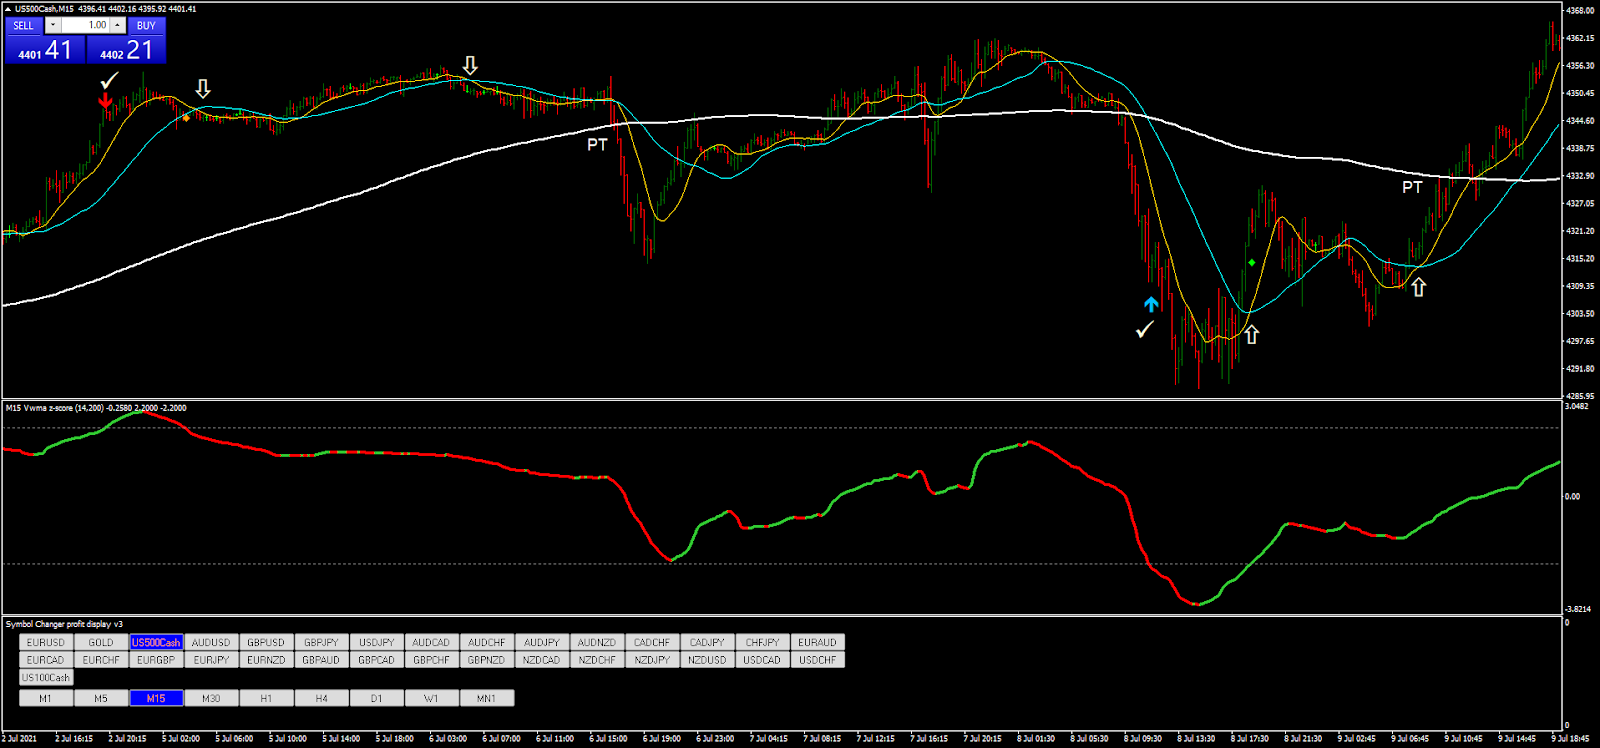
Statistical indicators include measures like the z-score. It quantifies how many standard deviations the currency pair is priced away from its mean price. High scores indicate strong deviations and provide traders with an arbitrage opportunity to enter long and short trades accordingly.
Regression analysis indicators
Regression analysis indicators are used to assess the relationship between different currency pairs across the same or different platforms. This helps traders identify small mispricings or deviations from the expectation relationships and enter forex trades accordingly.
For example, if a currency pair is priced slightly lower on platform A than on platform B, traders can enter a short trade on platform A and a long trade on platform B to gain from both falling and rising markets.
Risks and advantages of using the statistical arbitrage strategy
Risks
-
Data quality risk: Poor or inaccurate data can lead to faulty models and misleading signals
-
Overfitting risk: Models may become too tailored to historical data, reducing their effectiveness in future market conditions
-
Liquidity risk: Low liquidity can hinder the ability to execute trades at desired prices, impacting gains
Advantages
-
Gains from market inefficiencies: Exploits short-term mispricing to achieve potential gains
-
Diversification: Can spread risk across various assets, reducing the impact of any single investment
-
Market neutrality: Often aims to be market-neutral, minimizing exposure to broad market movements and focusing on relative price changes
Step-wise guide to using the statistical arbitrage strategy
Define the strategy parameters
Establish the core parameters of the statistical arbitrage strategy, such as defining trade threshold levels, specifying time horizons, and more.
Gather and prepare data
Collect relevant financial data to be used for statistical analysis. This includes, but is not restricted to, historical price data, trading volumes, and more. The data must be clean and formatted since the quality of the analysis depends on its accuracy.
Analyze statistical relationships
Use statistical techniques like regression analysis to examine the relationship between different currency pairs in various time periods. Traders can calculate cointegration, correlations, and more to identify pairs with a predictable relationship. This step can help traders find price inefficiencies and gain.
Develop statistical methods
Traders then need to construct statistical models based on the relationships identified. These models help traders forecast future prices and generate trading signals accordingly. Traders with personalized criteria can easily curate models like mean reversion models, pair trading models, and machine learning algorithms.
Backtest the strategy
Test the models created using historical data and evaluate their performance over this time period. This helps traders understand how the strategy performs in different markets. Hence, they can determine the strategy's effectiveness and make necessary changes.
Implement the strategy
The next step is to implement the statistical arbitrage strategy in a live trading setup. This allows traders to execute trades according to the trading signals generated by the models.
Monitor and manage the strategy
Traders should continuously track the performance of their strategies and make necessary adjustments. Traders can do this by reviewing trade outcomes, reassessing model parameters, and adapting to dynamic market conditions.
Identifying market mispricing with the statistical arbitrage strategy
Statistical arbitrage in forex trading uses the correlations between different currency pairs using statistical models to predict relative price movements.
Statistical arbitrage can be combined with other strategies, such as machine learning algorithms for more accurate predictions, risk management tools to mitigate potential losses, and sentiment analysis to gauge market psychology.
Trade smarter with low spreads and lightning-fast executions. Open a live account today and experience unparalleled support from our dedicated customer service team. Blueberry is here to help every step of the way!
Trade Now Open a Demo Account