
The slate is full of high impact data this week, which includes four central bank interest decisions as well as key consumer data. Of course we will continue to see volatility surrounding tariffs by President Trump, and negotiations with Russia over a ceasefire are set to continue. Volatility had declined last week but are we set for this to rise again?
Forecast for March 17, 2025
Key events to watch includes:
Monday: China industrial production and US retail sales data.
Tuesday: Canada inflation data is forecast to rise ever so slightly.
Wednesday: Central bank data will kick off in Japan followed by the US, with both central banks forecast to hold rates.
Thursday: Attention will turn to Switzerland and the UK as they announce their latest overnight rates.
Friday: Retail sales out of Canada will be watched closely after the recent trade tariff back and forth.
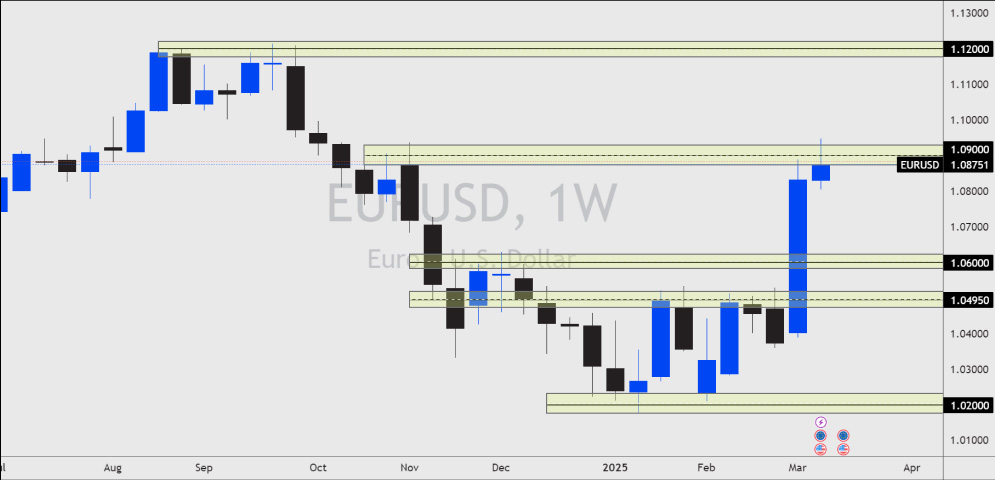
EURUSD Outlook
The EURUSD price continued to trade higher last week breaking through resistance highs of 1.0900. However, despite this the price failed to make a successful close higher. When looking into the commitment of trader reports we can see hedge fund net positions have reached positive territory for the first time since October of 2024.
Recent events which have seen US bonds rise and EUR bonds fall means investors are moving away from the US and into Europe. Combined with the defence spending increase in the EU has bought a lot of EURO strength.
That being said the EURUSD price may be a little sticky here, and with a slew of high impact data coming this week we may see the USD favoured in the near term. This may see EURUSD prices come in lower.
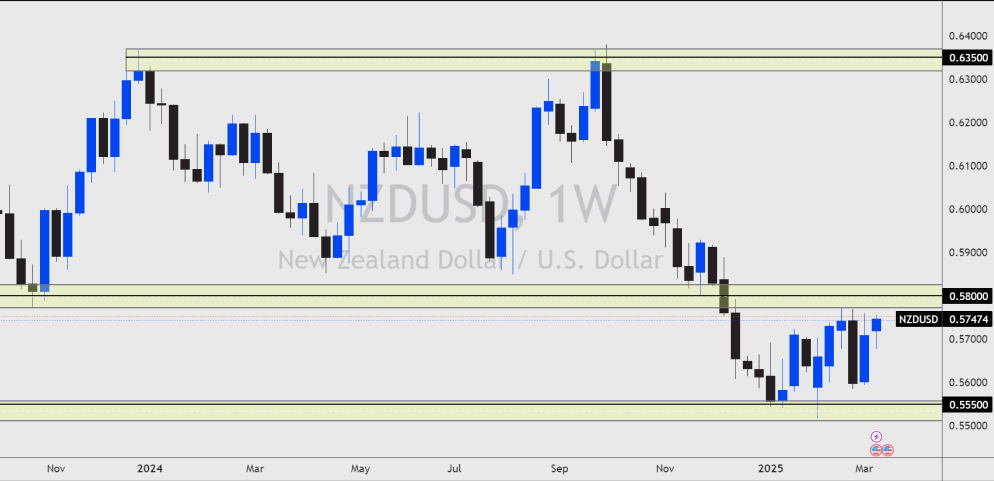
NZDUSD Outlook
NZDUSD and NZDJPY were on our watchlist last week after the commitment of trader reports highlighted hedge fund net positions to be at their lowest level in history. In the past this has been a sign of a potential reversal.
On Wednesday we see the release of quarterly GDP figures which is forecast to show growth of 0.4%. A big improvement from the previous quarter contraction of -1.0%. If we see this data beat expectations we may see a slight recovery in the NZD, especially as hedge funds back out of their short positions.
The NZDUSD price remains below the resistance of 0.5800 which could be breached this week. A break above this level could see sellers remove themselves and open the door to buyers.
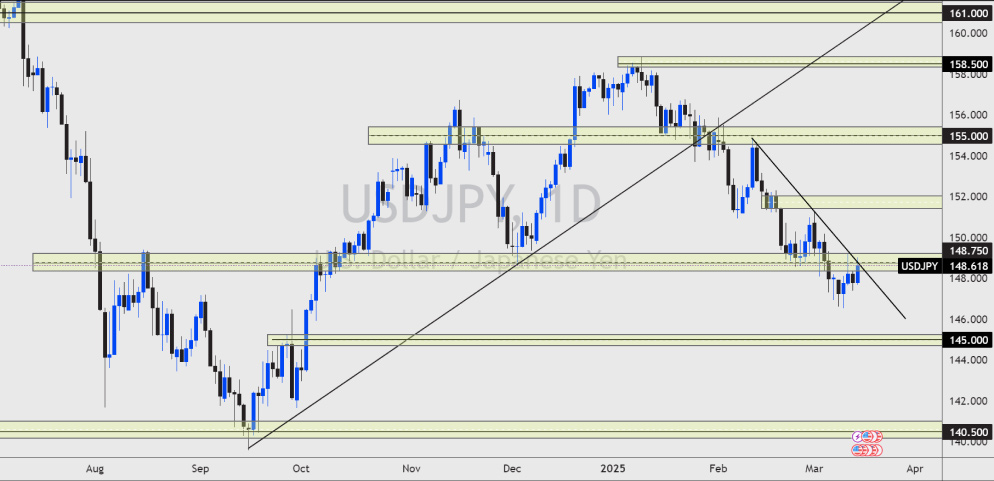
USDJPY Outlook
The USDJPY price remains in a downward trend after a new low formed last week. A daily downward trend is tracking closely with a trend line resistance formed from the 12th February high. A break above this resistance and the horizontal resistance of 149.00 could signal short term upside for the forex pair.
US10Y and USDJPY tend to follow a similar trend, so if US bond yields continue to fall then the price of USDJPY could go with it. If the price of USDJPY remains in a bearish trend then we could see the price trade towards support of 145.00.
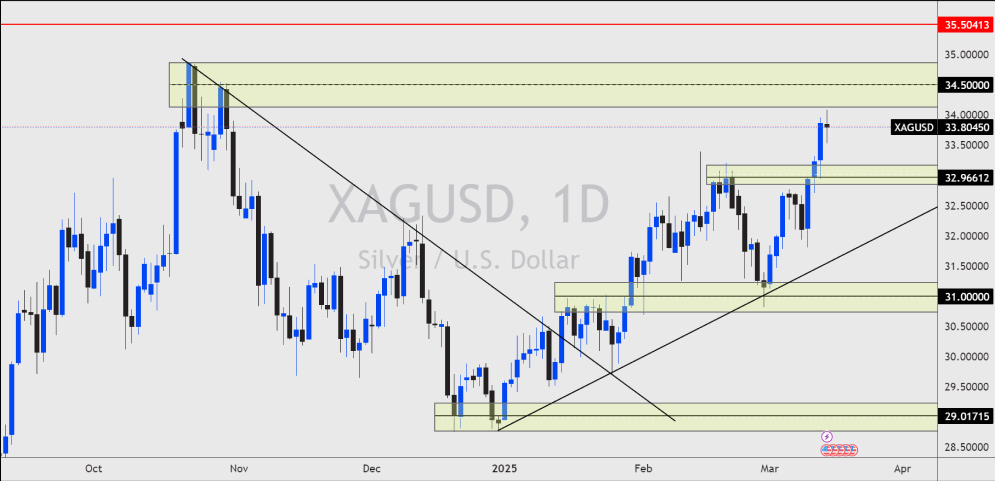
XAGUSD Outlook
Silver and Gold prices continue to climb with Gold reaching a new record high of $3000.00. The correlation between Gold and Siver remains high at 92.1% currently. So in theory if Gold prices remain bullish, then Silver prices could go with it. Silver has more potential upside targets as the record highs rest at $19.81.
The Gold/Silver ratio which compares the two precious metals together is also at a high level, reaching 90.00. The last time this ratio reached this level Silver prices rallied 47%. The feeling here is that I would see something very similar to happen again if the price can break through the highs of $34.00.
Trade smarter with low spreads and lightning-fast executions. Open a live account today and experience unparalleled support from our dedicated customer service team. Blueberry is here to help every step of the way!
Trade Now Open a Demo Account