
Headline risk will still remain this week as tariffs on imports of steel and aluminium are expected to go ahead this trading week. However, on the macro front attention will turn to the US inflation data. On Wednesday we are forecast to see the Bank of Canada cut interest rates by 25 basis points. Friday the UK will face fresh GDP data which is forecast to come in lower than the previous month at 0.1% down from 0.4%.
Forecast for March 10, 2025
EURUSD Outlook
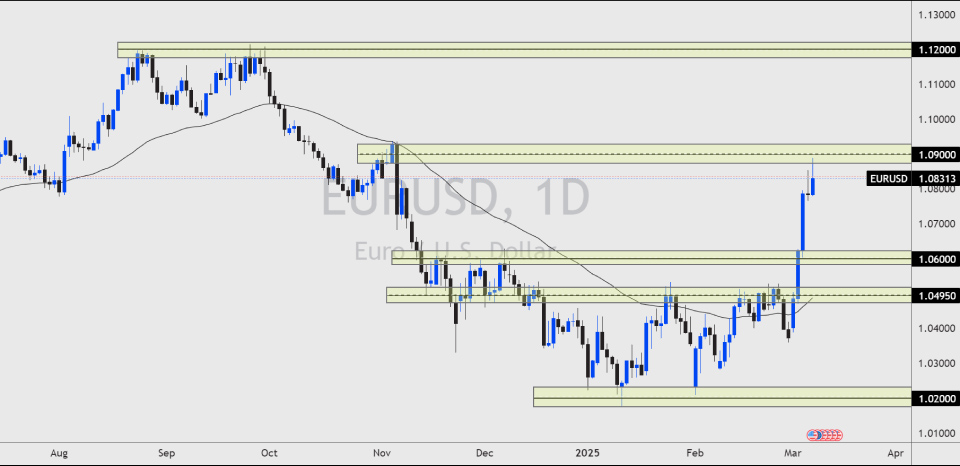
The European Commission announced a 800 billion euro defense package last week which completely changed the future outlook for the Eurozone. This package could significantly improve the EU’s GDP over the coming months perhaps years as infrastructure will need to be built and maintained. EURUSD jumped over 400 pips on the week, the largest gain since November of 2022.
The price of EURUSD now trades at the 1.0900 resistance level, this could prompt a short term correction on profit taking. If the Euro remains strong and the USD remains weak, then we may see the price trade through this key resistance.
USDJPY Outlook
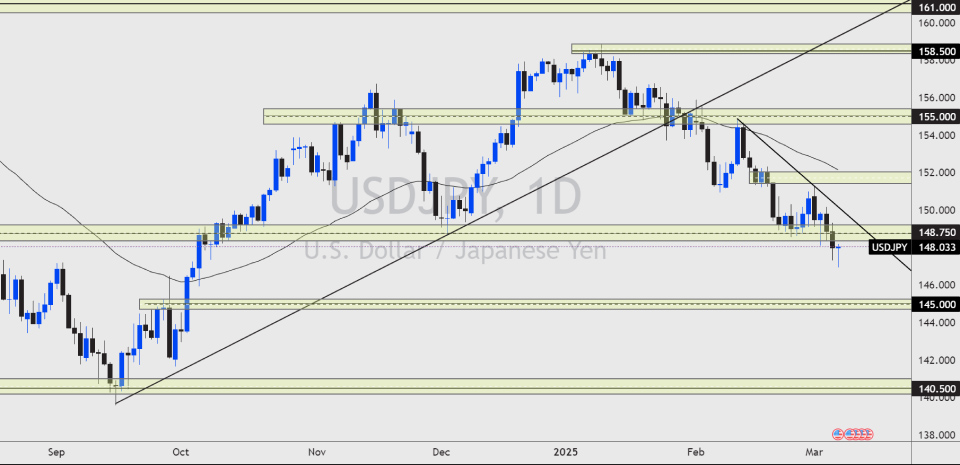
The price of USDJPY traded through the key support level of 149.00 showing the JPY’s strength against the greenback. The US stock markets falling has increased fear within the market helping the Japanese Yen gain strength across most currencies. If the price of USDJPY remains below this support then the price could continue to trade lower, with the next support found at 145.00.
If the US stock market rebounds on lower inflation data then USDJPY may trade back to the upside. The trend line resistance formed from the daily swing highs would need to break to see any bulls return.
Nasdaq Outlook
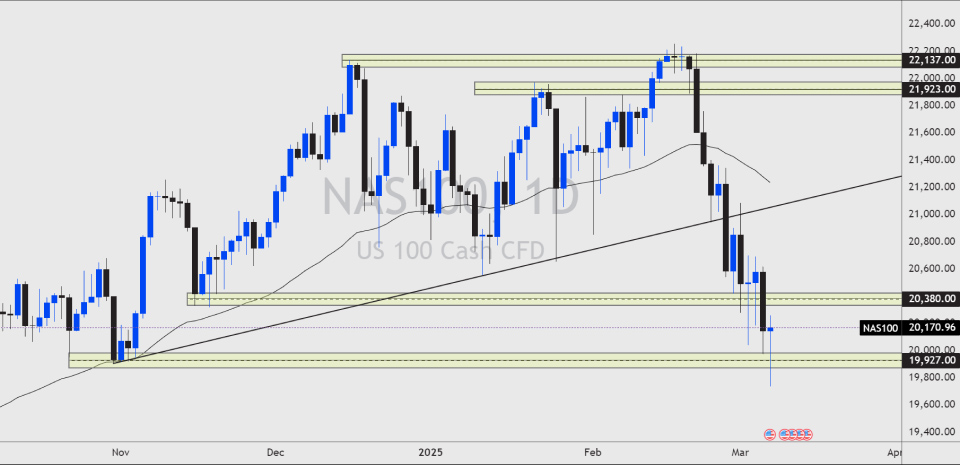
The Nasdaq price fell to its lowest level since November 2022 last week as the US stock market continues to show signs of fragility. At the moment this just could be another classic sell off in February and a bounce in March in line with the last 10 years of average trading. If that were to be the case then this may be the low for the stock market. Another positive could come from the US inflation data. A lower than expected inflation number could cause the chances of a rate cut by the Fed to jump higher. This would be positive for the stock markets which could lead to a rebound.
SILVER Outlook
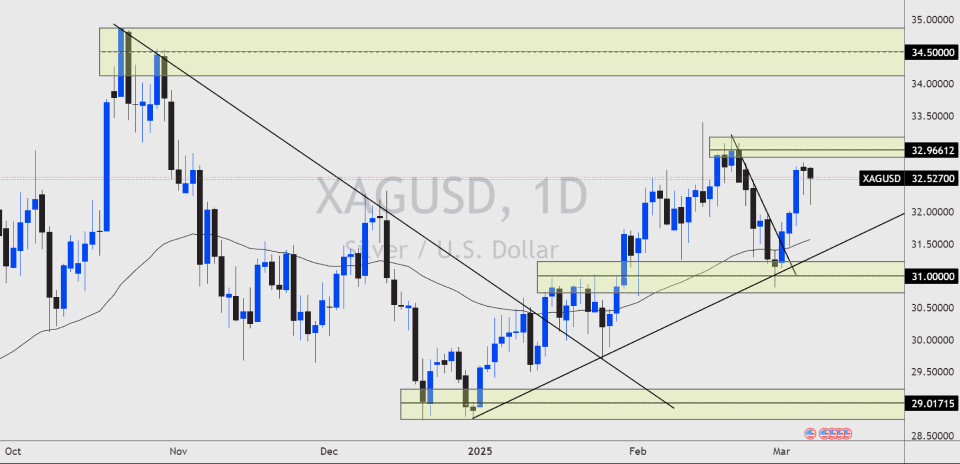
The price of Silver continues to head higher towards the key daily swing highs of $33.00. The Gold / Silver ratio shows that Gold is overbought vs Silver suggesting that investors may look for value in Silver rather than Gold. That being said, the price remains bullish for both precious metals and if this were to continue Silver may break into new highs this week. This would require the USD to remain weak, which could be the case as recent data suggest that demand in the market is slowing.
Trade smarter with low spreads and lightning-fast executions. Open a live account today and experience unparalleled support from our dedicated customer service team. Blueberry is here to help every step of the way!
Trade Now Open a Demo Account