
Data may be overshadowed by the implementation of reciprocal tariffs by US President Donald Trump this week. On April the 2nd we are set to see the global tariff plan which the president has coined as ‘Liberation Day’. Markets have been uncertain on how aggressive the president will be with countries in surplus with the United States or whether we will see just a blanket tariff in place. Even staff close to the president are unsure on what and to whom tariffs will be implemented. With the prime example being the surprise 25% tariffs on autos towards the end of last week. Uncertainty saw the market shift back to risk off with JPY benefitting the most, and stocks taking a sharp dip.
Forecast for March 31, 2025
Key events to watch includes:
Monday: China manufacturing PMI is forecast to expand ever so slightly to 50.4.
Tuesday: The Australian dollar could take the headlines on Tuesday as the RBA announces their latest interest rate decision.
Wednesday: US President Donald Trump will announce global tariffs, which could cause market uncertainty.
Thursday: On this day Switzerland CPI will be in focus with forecasts showing a potential decline to 0.1%.
Friday: Non-farm payrolls in the US will take place, forecasts suggest more trouble for the US jobs markets.
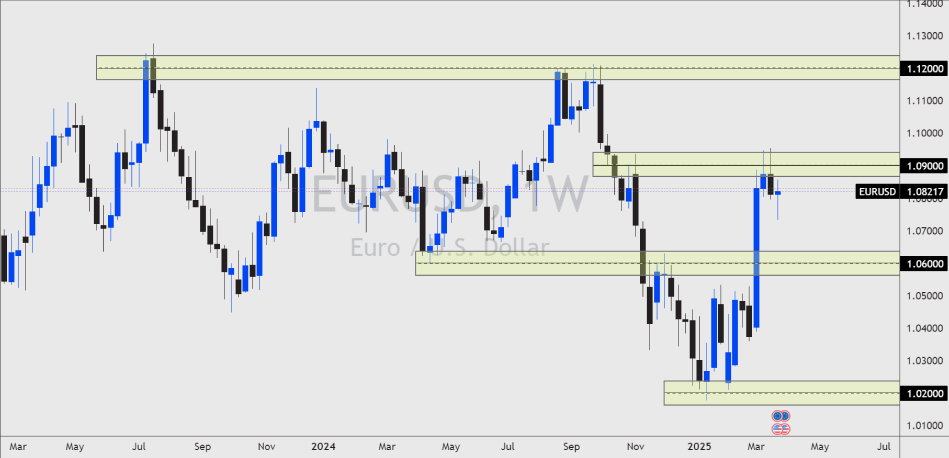
EURUSD Outlook
The price of EURUSD remains below the key 1.0900 level of weekly resistance. If the USD does remain weak due to underlying employment data then the price could attempt to break higher. However, if the US President Donald Trump announces tariffs that are ‘unexpected’ that could see USD buying in the short term. EUR remains a strong currency and with German stimulus still a strong influence then any downside to this forex pair could be limited.
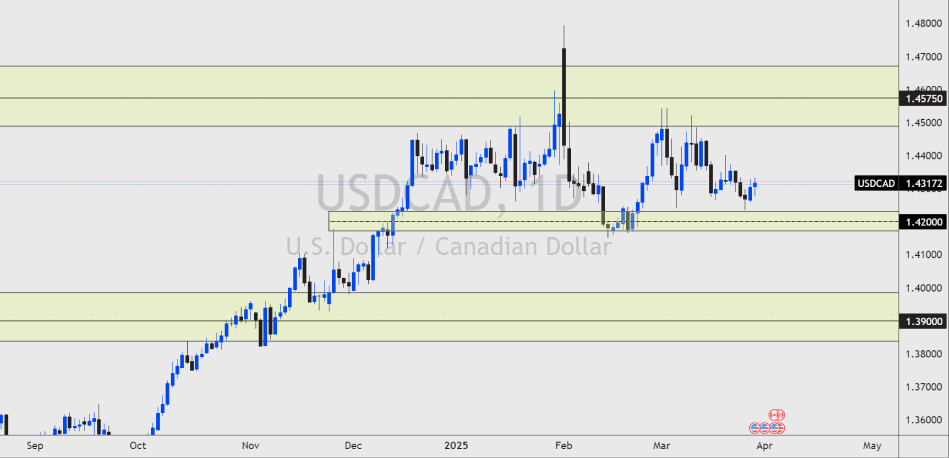
USDCAD Outlook
The USDCAD price has not been on our radar for some time simply because the tariff story has kept this forex pair in a trading range between the highs of 1.4600 and lows of 1.4200. The new Prime Minister of Canada Mark Carney has recently stated that the old relationship with the US ‘is over’, and could suggest that the former Bank of England head will take a strong stance on tariffs against the US. That being said the tariff narrative for Canada seems to be priced in by now, as this story has plagued this market for some time.
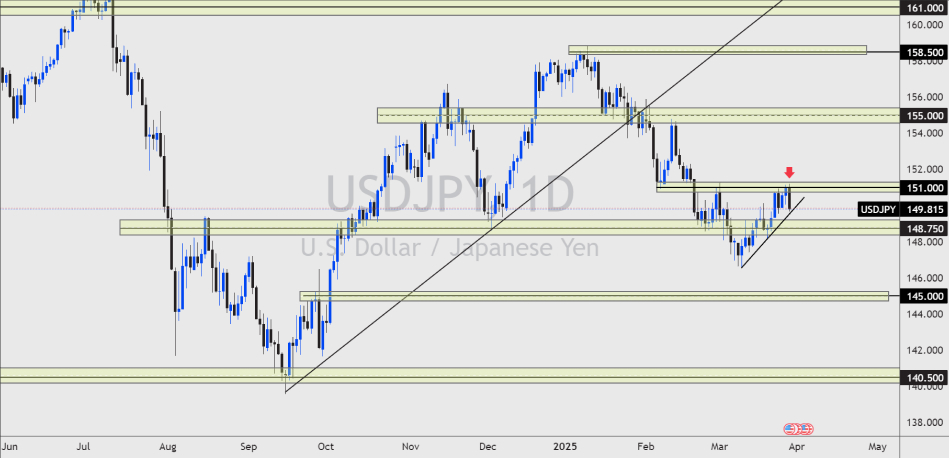
USDJPY Outlook
Well, the Japanese Yen looks to be the biggest beneficiary of trade tariff uncertainty. The currency strengthened at the end of last week as stock markets took another turn lower. Data still points to a future rate hike for the Bank of Japan, which certainly paints the Japanese Yen in a stronger light. And with this added influence of uncertainty then USDJPY could break lower. Currently, the price is rejecting the 151.00 handle, a break of minor trend line support and the horizontal support of 148.75, could see JPY dominate the USD once again.
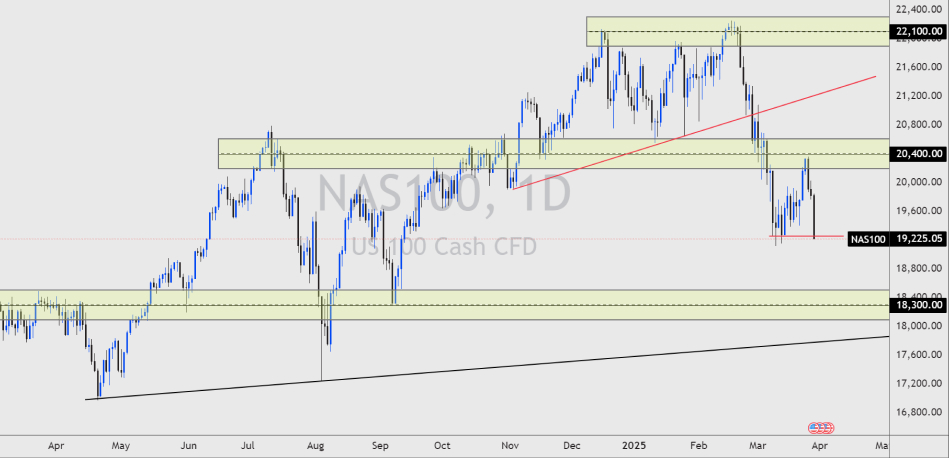
NASDAQ Outlook
US stock markets closed another week lower as investor sentiment continues to show US future vulnerability. Despite bond yields being lower, investors remain worried about future tariffs by Donald Trump. As long as this uncertainty remains the narrative of the stock market could remain the same. The price is heading towards the weekly support level of $18,300.00, here investors may have to question whether this is enough of a discount to confidently be a buyer again.
Trade smarter with low spreads and lightning-fast executions. Open a live account today and experience unparalleled support from our dedicated customer service team. Blueberry is here to help every step of the way!
Trade Now Open a Demo Account